Financial Consequences of switching to a Air-Sourced Heat Pump - Experiences after (now) a full year
On the Consequences to our Finances, the Environment, and our ongoing comfort and convenience as a result of the switch from a Gas-fired boiler to an Air-Source Heat Pump
Update - September 2024, full-year results added.
The post-Winter update stands; some details have changed, see below
Energy Reduction
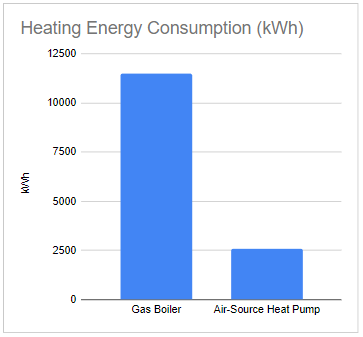
We’ve saved over 3/4 (to whit: 77.4%) of the total energy required to heat our house by switching to the Heat Pump.
Cost Reduction
We’ve also saved over 1/4 (29.6%) of the costs of heating our house from the switch. This is despite the effective cost-per-kWh doubling between the time periods.
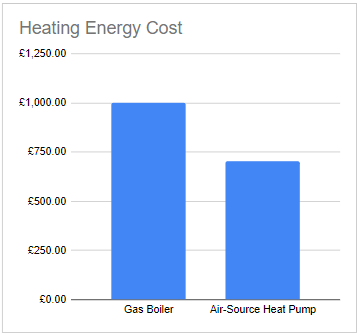
(This is the result I was pleasantly surprised by - I was expecting the total heating costs to have increased)
Convenience and Comfort
We’ve been just as warm between the two systems, in fact with noticeably fewer highs and lows under the Heat Pump which runs for a much longer period of the day than the Gas Boiler did. After some teething troubles we’ve had almost no need to make any adjustments to the heating system which has pretty much run itself unaided.
This concludes the tl;dr portion of the presentation. If you’d like more context and/or info, read on…
Background
We had a 10kW Air-Source Heat Pump installed in early August 2023, replacing our previous Gas Boiler system (age unknown; we assume it’s as old as the house so ~25 years or so). We’d previously had a energy efficiency assessment done which showed we were basically ok all be it with a bunch of things we probably should improve. But on things like loft insulation, cavity walls, double-glazing etc: basically ok1.
The decision to switch was not made on economic grounds: we’re bleeding-heart lefty ecological types, we’ve already got the electric car, solar panels and battery storage system, and we virtue-signal our way through life by helping out with local ecology groups and working in sustainability charities etc. Under those circumstances when one’s boiler becomes end-of-life you need a good excuse not to go full-eco-warrior on the replacement.
With all that said, we did include a “comfort” criteria: we’d retain a backup gas heating facility until and unless we were convinced the house would remain sufficiently warm.
And we also agreed it would be sensible to work out, after some experience, whether the switch was effective. This post is the result of that assessment.
Like all proper nerds we retain our bills in referrable form for unreasonably long periods. On this occasion this proved useful since we can compare energy costs for periods of time prior to and after the switch and work out the costs.
Method
The headline figures above were calculated by comparing Gas usage before and after the switch to Electricity usage before and after the switch. Differences between the two were ascribed to the switch from Gas Boiler to Air-Source Heat Pump.
(See here and here for some known problems with this approach)
Time Period
We haven’t had the system installed for a full year. So a proper year-on-year
comparison can’t be done yet. - Updated 2024-09-18, yes we have and yes we have. This description now only applies to the winter-to-winter analysis:
In this climate we’ve only ever run the heating system between about October to April, and certainly that’s the portion of the year that falls under the “demand” curve of the system. To make this comparison, I’ve therefore used 2 equal time-ranges covering the winters immediately before and after the switch to the Heat Pump.
- The “Before” period is August 2022 - April 2023.
- The “After” period is August 2023 - April 2024.
In both cases the months are billing months, broadly starting in the middle of a given calendar period. These don’t align across the suppliers (Gas tends to be billed several days after Electricity) but I’ve ignored this difference in the total calculations. Some of the intermediate calculations use by-day rates, and I’ve ensured they are adjusted to compensate for this. I expect the total effect on the sums as a result of billing skew to be minimal (especially as it’s consistent over the before and after periods).
Confounding Factors and Dealing with them
Energy Costs
Obviously over the timescales being used - a couple of years - the actual energy prices haven’t remained static. In fact, certainly on the Electricity side, the switch to the Heat Pump came just a couple of months after the largest price-rise we’ve ever had. This coincided with moving to a 3-tier schedule (off-peak, standard, peak rates both for supply and generation). Gas has remained at a steady cost-per-unit thoughout.
Thanks to home automation (including, after some initial aggro, a properly-working smart heating/hot water control system from Homely - click here for the details ), we’ve been somewhat isolated from the effects of this switch. Despite headline rates going up almost 4x from what we’ve previously been paying, the automation has been effective at controlling their impact2.
Other Energy Consumers
Both the Gas and Electric bills represent the total costs of supply, in both cases there are other uses for the energy source than heating that should be accounted for.
Gas
On the Gas side, however, we’ve only really got a gas hob that gets any use; there’s a gas fire in the living room but I honestly don’t think it’s been used over the entire compared period (possibly for an hour or two in the 2022/2023 period, but no more than that). The after-switch bills for this are therefore ludicrously small, and almost entirely consist of the standing daily charge. There’s been about a factor of 45 reduction in the amount of Gas we use, to the extent that eliminating it’s supply is not only possible but desirable.
Electricity
Electricity is (naturally) more complicated. We’ve got loads of consumers that aren’t related to the heating. There’s low-usage stuff like lighting, fridge, TV, all the many computers etc and there’s heavier-usage stuff like the kettle, oven, tumble drier, dishwasher etc.
From a consumption standpoint, though, all of this is swamped by the car, which is left plugged in and charged as required. Prior to the heat pump this was the dominant consumer driving our electricity consumption and costs. However, the specific amount is highly variable based on how and when it’s used. And, woe is me, I don’t have good figures for any of this.
I have therefore assumed - with some justification, as my annual mileage hasn’t really changed over the time period (Winter-Winter, see below for some notable differences year-on-year) - that the electricity consumption of the car has remained the same over the whole measured period.
Solar Generation
Between roughly March and the end of September we’ve confused our Electricity situation with the Solar system providing a substantial offset, which complicates trying to work out from bill data how much power we’ve actually used. Although I’ve got data on the totals generated vs consumed (because of course I do), trying to turn that into a financial figure (accounting for rate-changes, time-of-day billing, effect of standing charge etc) is just about impossible. Luckily, it’s also unnecessary: Our chosen time-window for comparison neatly excludes much of the peak-generation time.
Having said all that, I have used the “Net” figures for Electricity cost (i.e. those that include the payback from export) rather than the “Gross” figures. Because this is the difference we feel in the wallet due to the switch. I have used the “Gross” figures for energy consumption, taking no account of any exported electricity in the heating consumption figures. Since there’s no way to export Gas, it didn’t feel like a valid comparison to make between the periods.
The Weather
Winter 2023-2024 has been noticeably milder than Winter 2022-2023. However, it’s also dragged on longer (we’ve not had the Warm March of the last couple of years). Clearly this has changed the house’s total heating requirement. It’s hard to assess the effect this has on the calculations; certainly one would expect the “total consumption” numbers to be higher in colder periods, but the aggregate over the whole covered period (August->April) is harder to determine.
I’ve therefore ignored this change in my calculations but I’m flagging it up here as a confounding factor that might mean Your Results Will Vary.
Household Occupation
There were, on average, about 3.1 people resident in the house over the earlier winter period. In the later period this has dropped to about 2.2. I am, of course, referring to the fact that the kids have grown up and left home; Eldest has been absent (excepting vacations) throughout the whole covered period. Youngest only left us last September (with the same return schedules) meaning there’s a measurable difference between the periods.
I don’t think it affects the heating requirement on the home (smart-alecs will point out a human contributes 100-200W constant heat input to a house, rational people will roll their eyes and ignore it’s effect as trivial). But, based on my own experiences3 I’m fairly sure there’s some impact on Hot Water supply. Since this is supplied by the central heating system (i.e. initially Gas, now Heat Pump) it’s reasonable to conclude the second period under examination has seen a reduction in demand commensurate with the reduction in hot water usage caused by the absence of consumers.
I am unable to effectively account for this difference, however, and have chosen to exclude it from the calculations.
Full-Year update - September 2024
I debated doing a full new post but with the same methodology applied to usage and costs, the actual results are broadly the same. Hence this section here as a update.
(written in mid-September 2024)
Results
These charts and results now cover two full-year timespans:
- August 2022 - August 2023: Household heating supplied by Gas Boiler
- August 2023 - August 2024: Household heating and hot water supplied by Heat Pump
(The same caveats apply as for Winter billing periods; there’s about 10 days of Heat Pump in the Gas Boiler period cost data but it was hot and neither was being used).
Energy Comparison
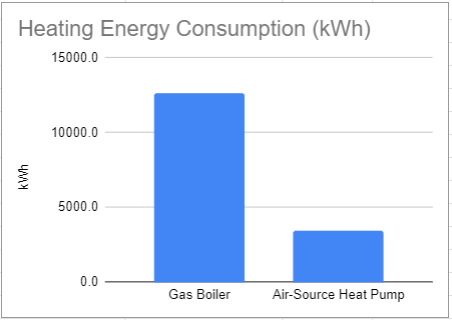
Comparing energy usage, year-on year this dropped by 72.7%, slightly under the figure winter to winter:
Cost Comparison
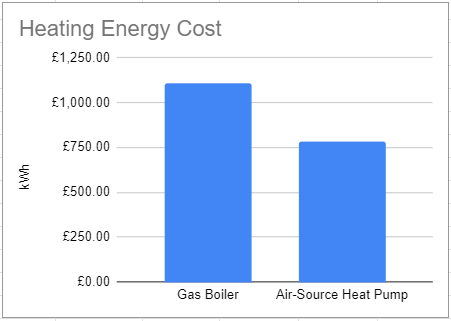
Comparing energy costs, however, the full-year saving has remained at about 29% over what we paid to heat our home with gas:
Explaining the Differences
It’s notable that there’s a decrease in the full-year energy usage saving of about 5% total consumption. This needs examining because (if unexplained) it’s suggesting less efficiency during the warmer months, which doesn’t feel right.
This is where we run into the main problem with my methodology - I have no way of separating out electricity use by device based on the billed data4. My calculations are only accurate IF all change in electricity usage between the two periods is due to the heat pump. This is clearly never going to be the case.
Having said that, most household usage scenarios won’t amount to a significant difference (and thus change the outcomes). A couple of cups of tea (boiling the kettle) a day is surprisingly insignificant5. There’s one exception though: the car.
Every (non-trivial) trip made in the car usually results in a recharge at home of about our average daily electricity consumption (~20kWh). For various reasons the distance travelled makes little difference to this6, to a first approximation it’s the number of trips that matter not the mileage. It should be easy to see, therefore, that year-on-year comparisons are significantly affected by the number of longer-distance car journeys made.
Here’s where you’d expect me to pull up data of all my trips, but sadly I don’t keep that any more (I used to keep a refuelling log for previous IC cars, but that all felt very analogue…). Instead I have to now go on memory and intuition:
Over the 2 winter periods I can believe that we made about the same number of car trips; it’s a quieter time of year, I’m not travelling for work any more, we do the same sorts of things at Christmas and Easter and in the 2 time periods I’ve had roughly the same amount of weekend commitments requiring a drive. So I have some confidence that the Winter energy comparison is reflecting changes mainly due to the heat pump.
However, the full-year period does have differences. In particular this year I can point to at least 4 longer car trips we’ve made over and above the number we made last summer, outside the “winter” period. This will make a noticeable difference in the amount of electricity used in this period over and above that caused by the switch to the Heat Pump.
I am therefore reasonably confident that increased car usage is the major cause behind the apparent loss of savings in energy efficiency shown by the graphs, rather than any additional usage by the Heat Pump in the time period being discussed
Cost-normalisation between the time periods
One factor that’s not fully explained in the text above is that we were subject to several changes during the time period described:
- Switch from Gas Boiler to Heat Pump
- Approximate doubling of electricity unit costs
- Battery Usage Profile change from self-powered to Time-Based Usage
When discussing the cost savings between Gas and Heat Pump, without accounting for the additional two changes it’s impossible to draw any conclusions. This is why I went for “net cost” but “gross consumption”.
Most people considering a move to a heat pump wouldn’t be in this position, and the ability to obtain the running-cost benefits would be impacted by this. In our experience the two additional factors cancelled each other out to some extent2, so instead of our “consumed” kWh costs doubling (or more, at peak times!) we saw instead only a 60% effective increase.
The energy costs in the results above both account for that saving factor; if we’d been restricted to grid electricity this year then, despite saving over 70% of energy we’d still end up having paid about the same amount of money in heating costs7. But again, this is a worst case - if (electricity) energy costs had stayed about the same over the time-period then we’d have done better than that. This appears to be worth a what-if that might be helpful to others in the decision making process.
To re-state the obvious, the “before” and “after” costs when making a switch like this boil down to:
- How much energy you saved in the switch
- The ratio between:
- The (effective) cost per unit energy of gas.
- The (effective) cost per unit energy of electricity
In the time period we’re studying, Gas prices broadly speaking stayed the same. Electricity prices doubled. There is some reason to believe that this differential will decrease in the future (Electricity prices are already down from last winter’s peaks, it’s not unreasonable to assume Gas prices will rise in future). The Gas:Electric ratio in 2022/23 was about 1.5, whereas in 23/24 that increased to 2.3 (each kWh of electricity costing 2.3 times as much as a gas kWh). If we’d been able to pay 22/23 electricity rates in 23/24, then the cost of heating the house over that time period would have dropped by 55% not the 29% we actually saw:
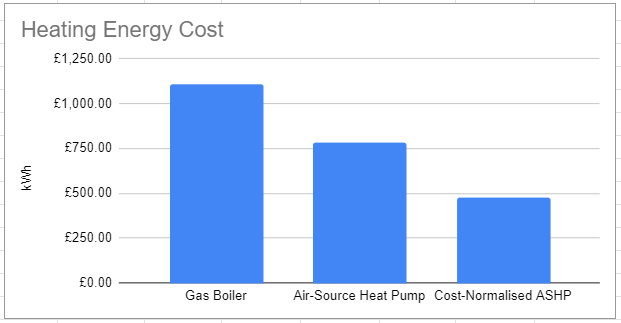
This conclusion is, clearly, imaginary however I think the process is important to bear in mind when considering a switch like this: If the ratio of energy prices is too high, you’ll struggle to make cost savings. It’s worth emphasising that too high is installation-specific - the more efficiency you can get (the higher the percentage energy usage saving), the higher the Gas:Electric ratio you can tolerate and still come out ahead.
Conclusions and Recommendations
In short: Great. Really happy with it. Works better, keeps us more comfortable with less effort and saves us money and is better for the environment. What’s not to love?
Hold on, what’s that honking great pachyderm doing over there in the corner? The installation costs you say? Ah…
It wasn’t cheap to put in. We needed bigger radiators, a larger hot water tank, there was extensive disruption and we’ve gained a whole heap of pipework, cylinders, valves and other fittings in the roof space that pretty much look like a H.R.Geiger installation. There’s the small matter of a honking great box sat outside the kitchen window that makes a continuous (but, admittedly, quiet) hum as it works too.
Overall I think we’ve decided that it cost something like 3x the cost to Just Replace The Boiler. If we’d been losing money on the running costs I’d finish there but, since we’re making a saving, I can confidently state that we will, eventually recoup that cost. The question then becomes: how long? At current gas/electric rates I think we’re looking at a 20-year period to do so. And I’m assuming no major unplanned maintenance costs in that timeframe8.
The economic bet, therefore, is that the differential between Gas and Electric prices decreases over time. If that decreases, the time to payback decreases. I don’t think this is too far off the mark on current trends, but 20 years is a long time. I’m encouraged by recent government action on renewables which ought to help manage electricity costs in the longer term. Fingers crossed.
With all this in mind, can I recommend a switch to a Heat Pump? In all aspects other than financial, an unequivocal and enthusiastic “YES”. If money is a consideration - and lucky you if it’s not - then more thought is required. It might represent a reasonable return compared to, say, a standard savings account but you could undoubtably do better if you’re looking at it that way. On the other hand if you find yourself having to borrow to afford the system, then some really, really hard sums will need doing to prove that the energy cost savings outweigh whatever financing rate you’re subjected to.
-
The front door being a hilarious exception. It’s got gaps you can watch the outside world through and is basically transparent to an IR camera meaning it’s got the insulation value of a piece of wet lettuce. Still on our list of things to replace…. ↩
-
In Time-Based usage, the battery is charged from the grid overnight at the cheapest rate, we use Solar during daylight normal rates (exporting the excess), then the Battery supplies 100% household power during afternoon/evening peak time with all Solar being exported at the maximum rate. Clever stuff. ↩ ↩2
-
Specifically: Cold showers when abluting after a bike-ride when certain household members have decided they need a long bath to unwind from the stress of exam preparations…. ↩
-
Ideally we’d have specified a power meter fitted to the heat pump on installation and then I’d be able to avoid this embarrassing post-facto rationalisation and justification. Ho Hum. ↩
-
Provided you don’t fill the kettle every time. Sure, the kettle draws 3.1kW but it only take 90 seconds to boil; that’s about 80Wh of energy or, to put it another way you’d need to add 12 extra cups of tea a day to make a 5% difference to our average usage. I bet your bladder isn’t up to that, I know mine isn’t. ↩
-
We’ll ignore trips to the shops etc, they only cost a few kWh. For longer trips, we’re either making an out-and-back (up to150 miles) or doing a longer journey where we recharge en route. Even when we’ve charged away from home we’re arriving back home with less than the “standing charge” so there’s a recharge required. By observation, this is about 20kWh or about a day’s average household usage. ↩
-
I think we’d actually have saved £50 or about 3.5% but given the previous fuzz around other usage changes I don’t think I can put a high confidence-factor on that…. ↩
-
We’ve had an annual service done on the Heat Pump. It was more expensive than a no-action service on the old Gas Boiler but a) we weren’t getting many of those, most years something needed changing/fixing b) It’s still cost less to service than we saved in running costs, we’re still ahead but not by as much as these headline figures would indicate… ↩