Why use the built-in TrafficAnalyzer GUI when you can roll your own?
Motivation
I find the built-in TrafficAnalyzer GUI only marginally useful on ASUS routers,
even with the asuswrt-merlin firmware loaded. It’s not that the features aren’t
there, it’s that the selection options to change time-range, client, app etc
just don’t seem to work very intuitively.
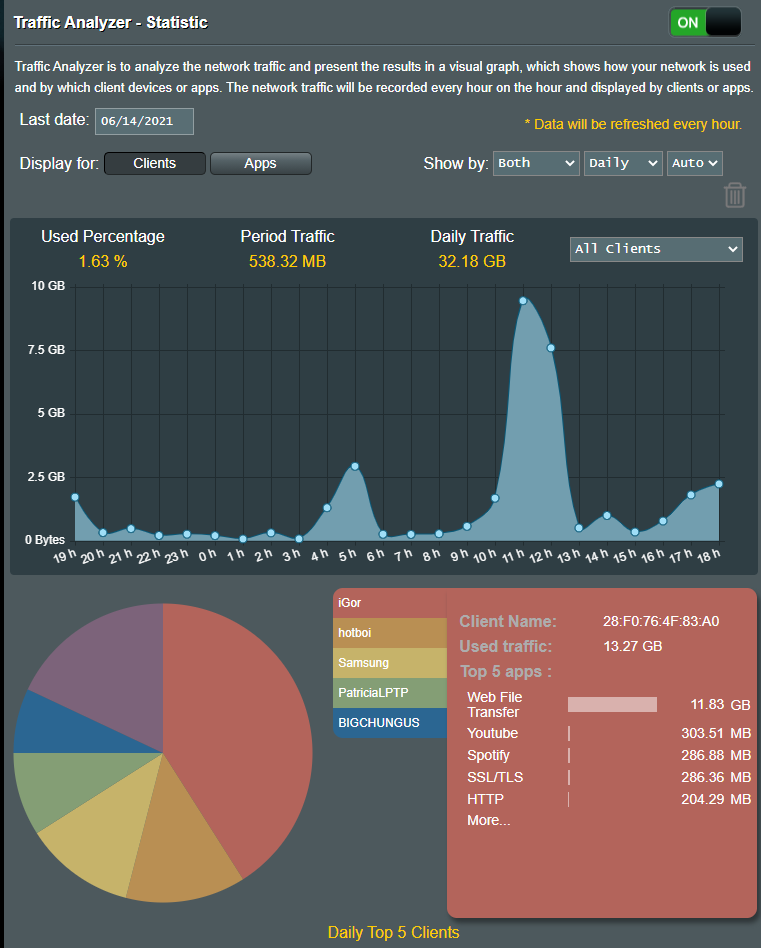
(Changing the “show by”, or the “all clients” or switching to Apps just doesn’t seem to update the charts reliably).
It’s also got the fundamental flaw that only the top 5 of anything is ever shown.
The solution is obvious: Write your own.
tl;dr
Here’s the repo that can process the data into Influx: AsusTrafficData repository on Github
About the code
The code as-is is really only about half a solution. I mean, it’s the most important part - the bit that processes the Traffic Analyzer data and splurges it into an influx database for later visualisation.
This is for 2 reasons:
- Laziness. I’ve solved it for myself and it’s not a hard problem for someone else to crack.
- Complexity. The less I bake into the code the more flexible the solution is. Everyone does visualisation, data copy and all differently why prevent it?
On the plus side, I don’t think the code requires any additional libraries to be installed provided you’ve already got Python working with Influx. There’s plenty of guides on doing that yourself if you need to.
Usage workflow
As I’ve got it on my server, here’s what’s happening:
- I wrote a simple shell-script that retrieves the required files from my router and puts them into a local directory
- I schedule this script - via
cron- to run once an hour because the TrafficAnalyzer code only updates the on-disk database at this interval anyway - I have a separate schedule - again, in
cron- set to run independently after the file-retrieve that runsread_traffic_database.pyto process and upload the new metrics to Influx - I have a Grafana install with a datasource pointing to the new Database.
- At the minute, I’ve just got the one Dashboard that allows visualisation over any selectable time-range for all or a selection of clients and breaks down the client’s traffic over that period by “Category” and “Application”:
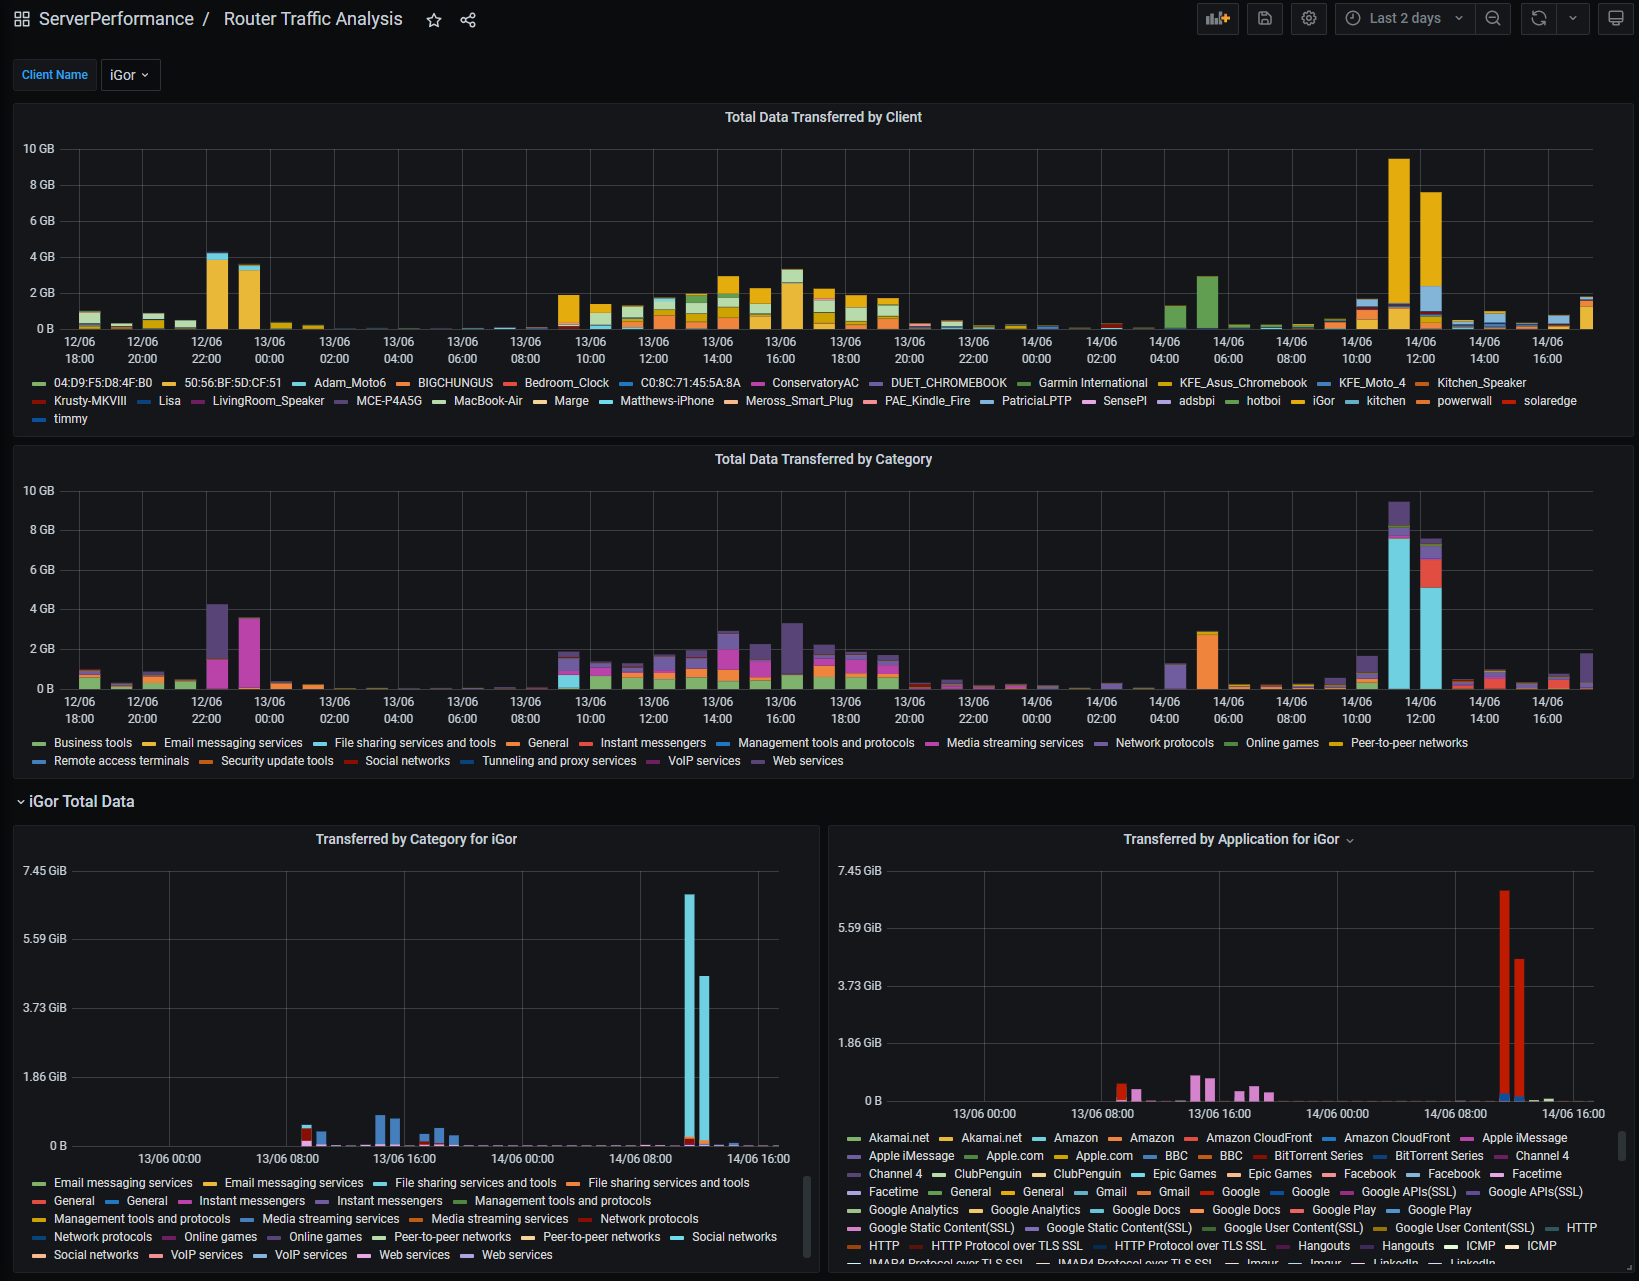
Over time I’m sure I’ll put a bit more work into the visualisation part but for now I’ve got what I actually wanted out of the project - show me the big hitters, what sort of thing they’re doing, and when - so the Itch has been Scratched.