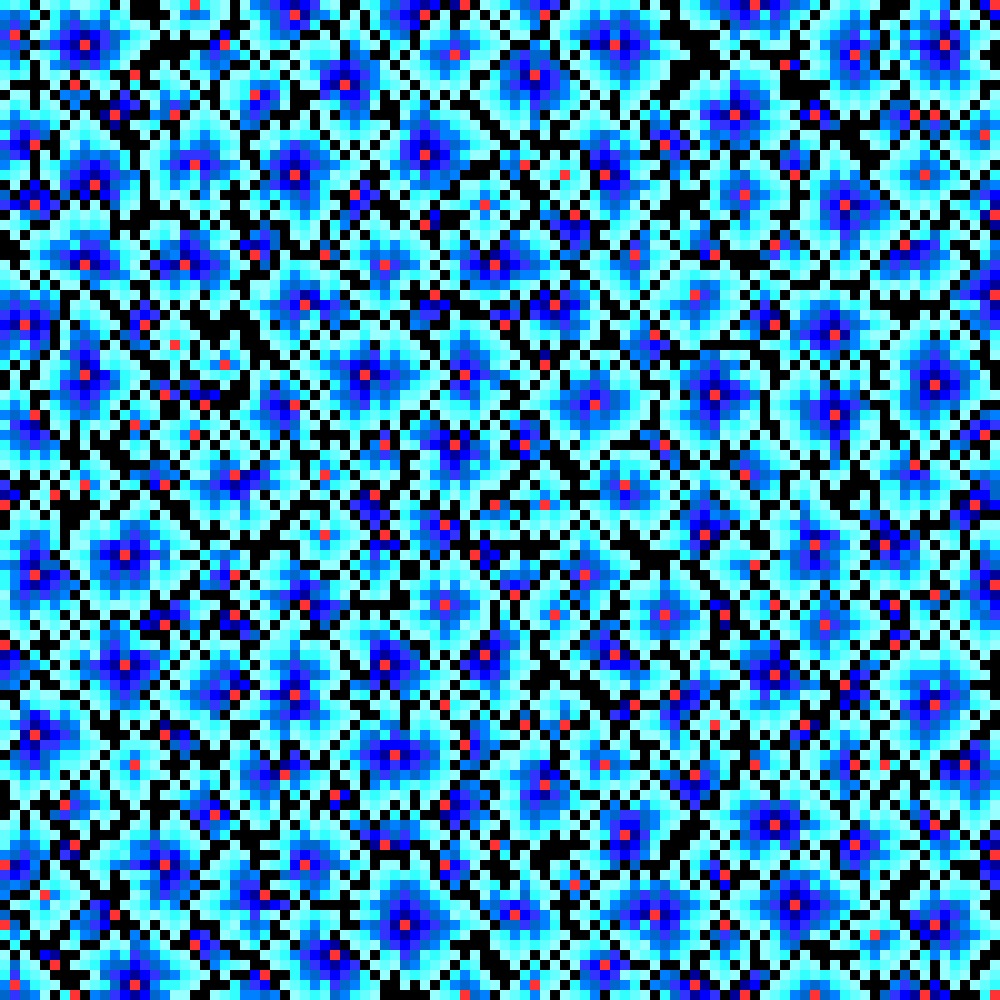
Visualisation of AOC 2021 Day 9, Part 2 answer
When a problem is just begging to be visualised…
Per previous updates, today’s problem was begging to be visualised. Here is my attempt - the borders of the “basins” (all input values of 9) are shown in black, the depths of each “basin” go progressively deeper blue as you get deeper, and the identified “low points” (which are used as the Part 1 answer, and also the starting point for growing the basins which are the Part 2 answer), are identified as bright red.
The input was 100x100 so I’ve upscaled by a factor of 10 for clarity, but this web page scales that back to 50% until you clicky the actual picture.

Code to generate the solution and the visualisation is in the github repo at: python/day9part2_extracredit.py