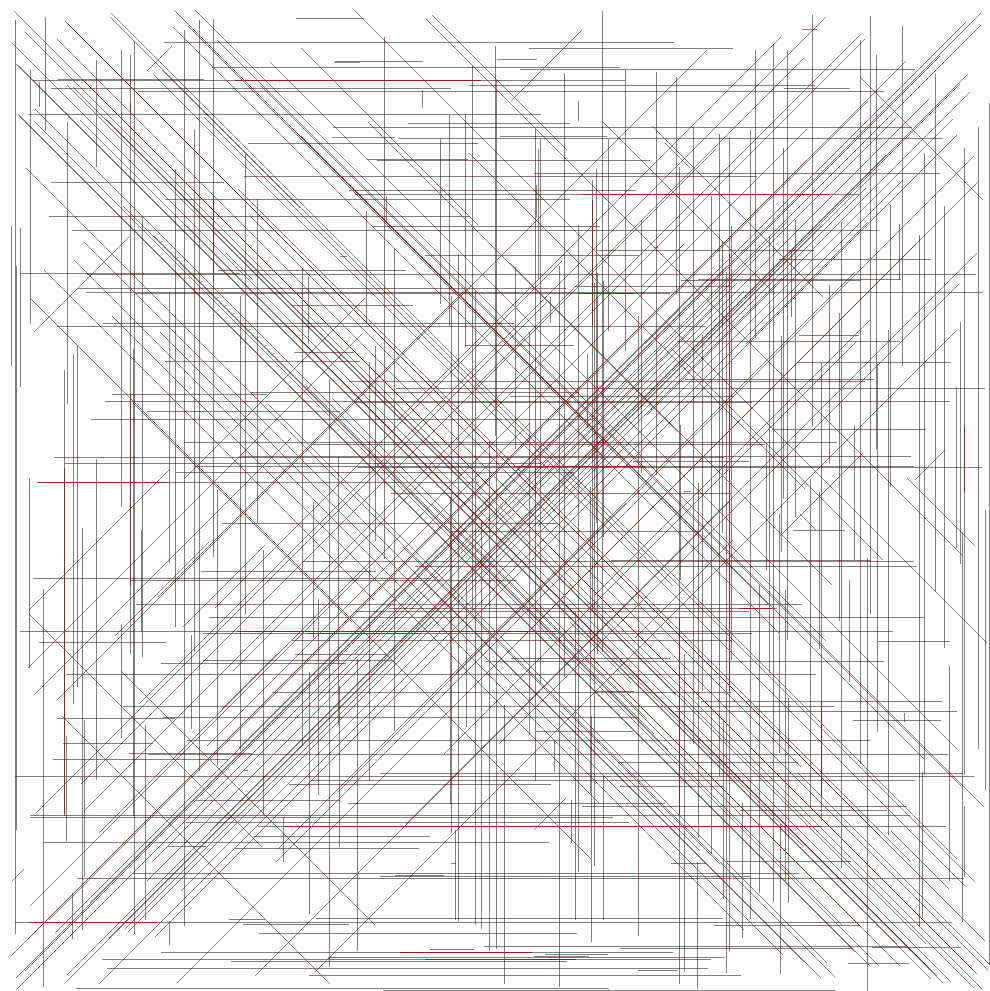
Visualisation of AOC 2021 Day 5, Part 2 answer
Writing Graphics To Visualise Answers
I see visualising your answers is the Hot New Thing on r/adventofcode and today’s problem - Work out the intersections of a series of geothermal vents - lent itself perfectly to this. Not least of all because the easiest way to actually come up with the answer you need was to, er, plot lines on a grid.
So here’s my visualisation of the solution for my input data:

The code used to generate it (but not the source data, which is kinda-sorta private to me) is in my answers github repo as python/day5part2_extracredit.py
Update - Movies are Cool
After working out that appending to lists is slow but extending arrays is fast I was able to make the image generation fast enough to generate a frame for every vent being plotted. Which, using the magic of ffmpeg via the incantation:
ffmpeg -framerate 25 -f image2 -i day5part2_%d.png -c:v libvpx-vp9 -pix_fmt yuva420p movie/day5part2.webm
…leads to the glorious animation you see before you:
(Embedded video support seems a bit wonky. Click here to view the video directly)